
For the past 18 months, University of New England researchers at the Applied Agricultural Remote Sensing Centre (AARSC) have been mapping protected cropping systems (PCS) across Australia, from simple polytunnels to vast high-tech glasshouse facilities, in a significant national project backed by Hort Innovation, Protected Cropping Australia, Local Land Services and the Future Food Systems CRC (FFS).
“The map will assist the protected cropping industry in preparing for biosecurity incursions and coordination of on-ground surveillance, and for quantifying the impacts following a natural disaster event,” says AARSC Director and Australian PC mapping project lead Professor Andrew Robson. “Identifying the location of specific farming systems also provides essential information around value-chains, traceability, transport and market accessibility.”
A recent biosecurity breach that led to the incursion of varroa mite into some agricultural regions of New South Wales shows the value of the mapping exercise.
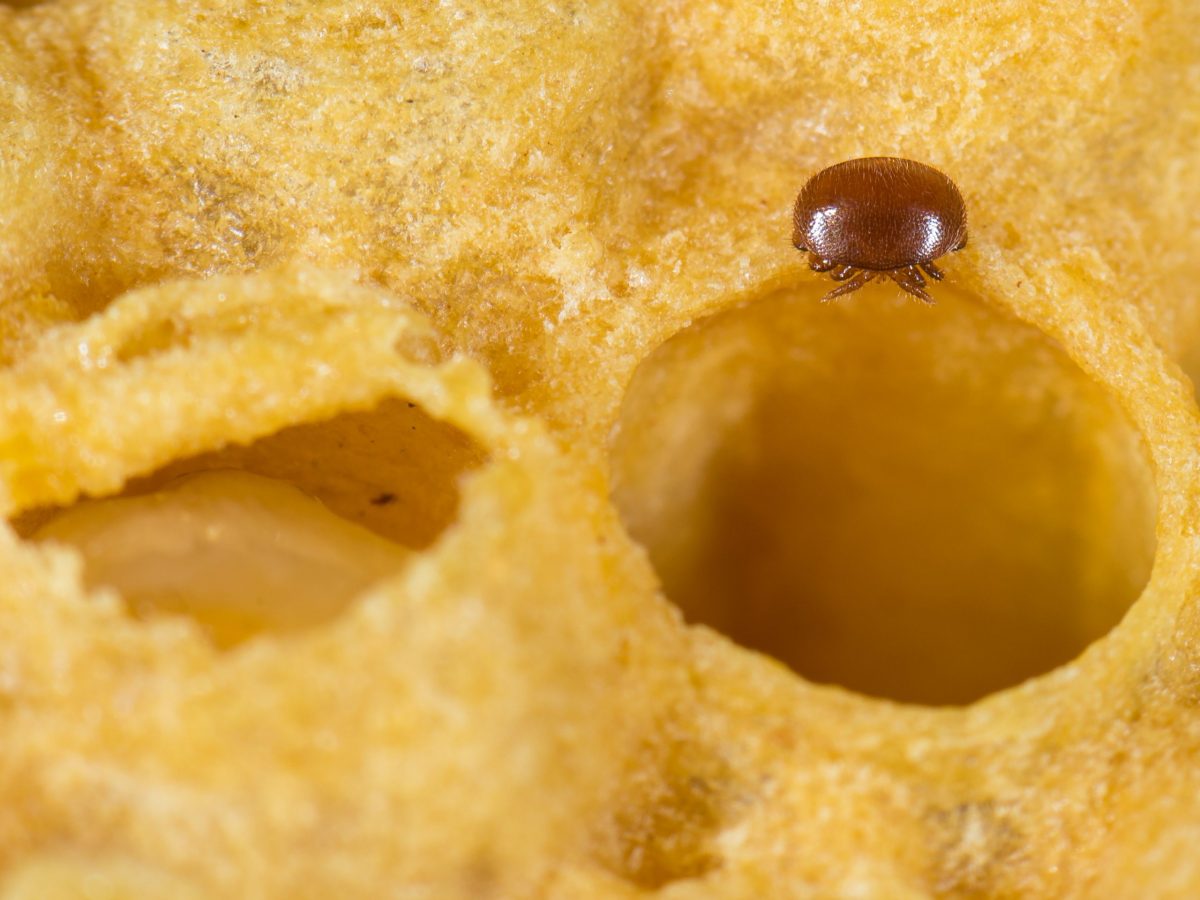
Varroa destructor mite on a honey-bee honeycomb. Credit: Shutterstock
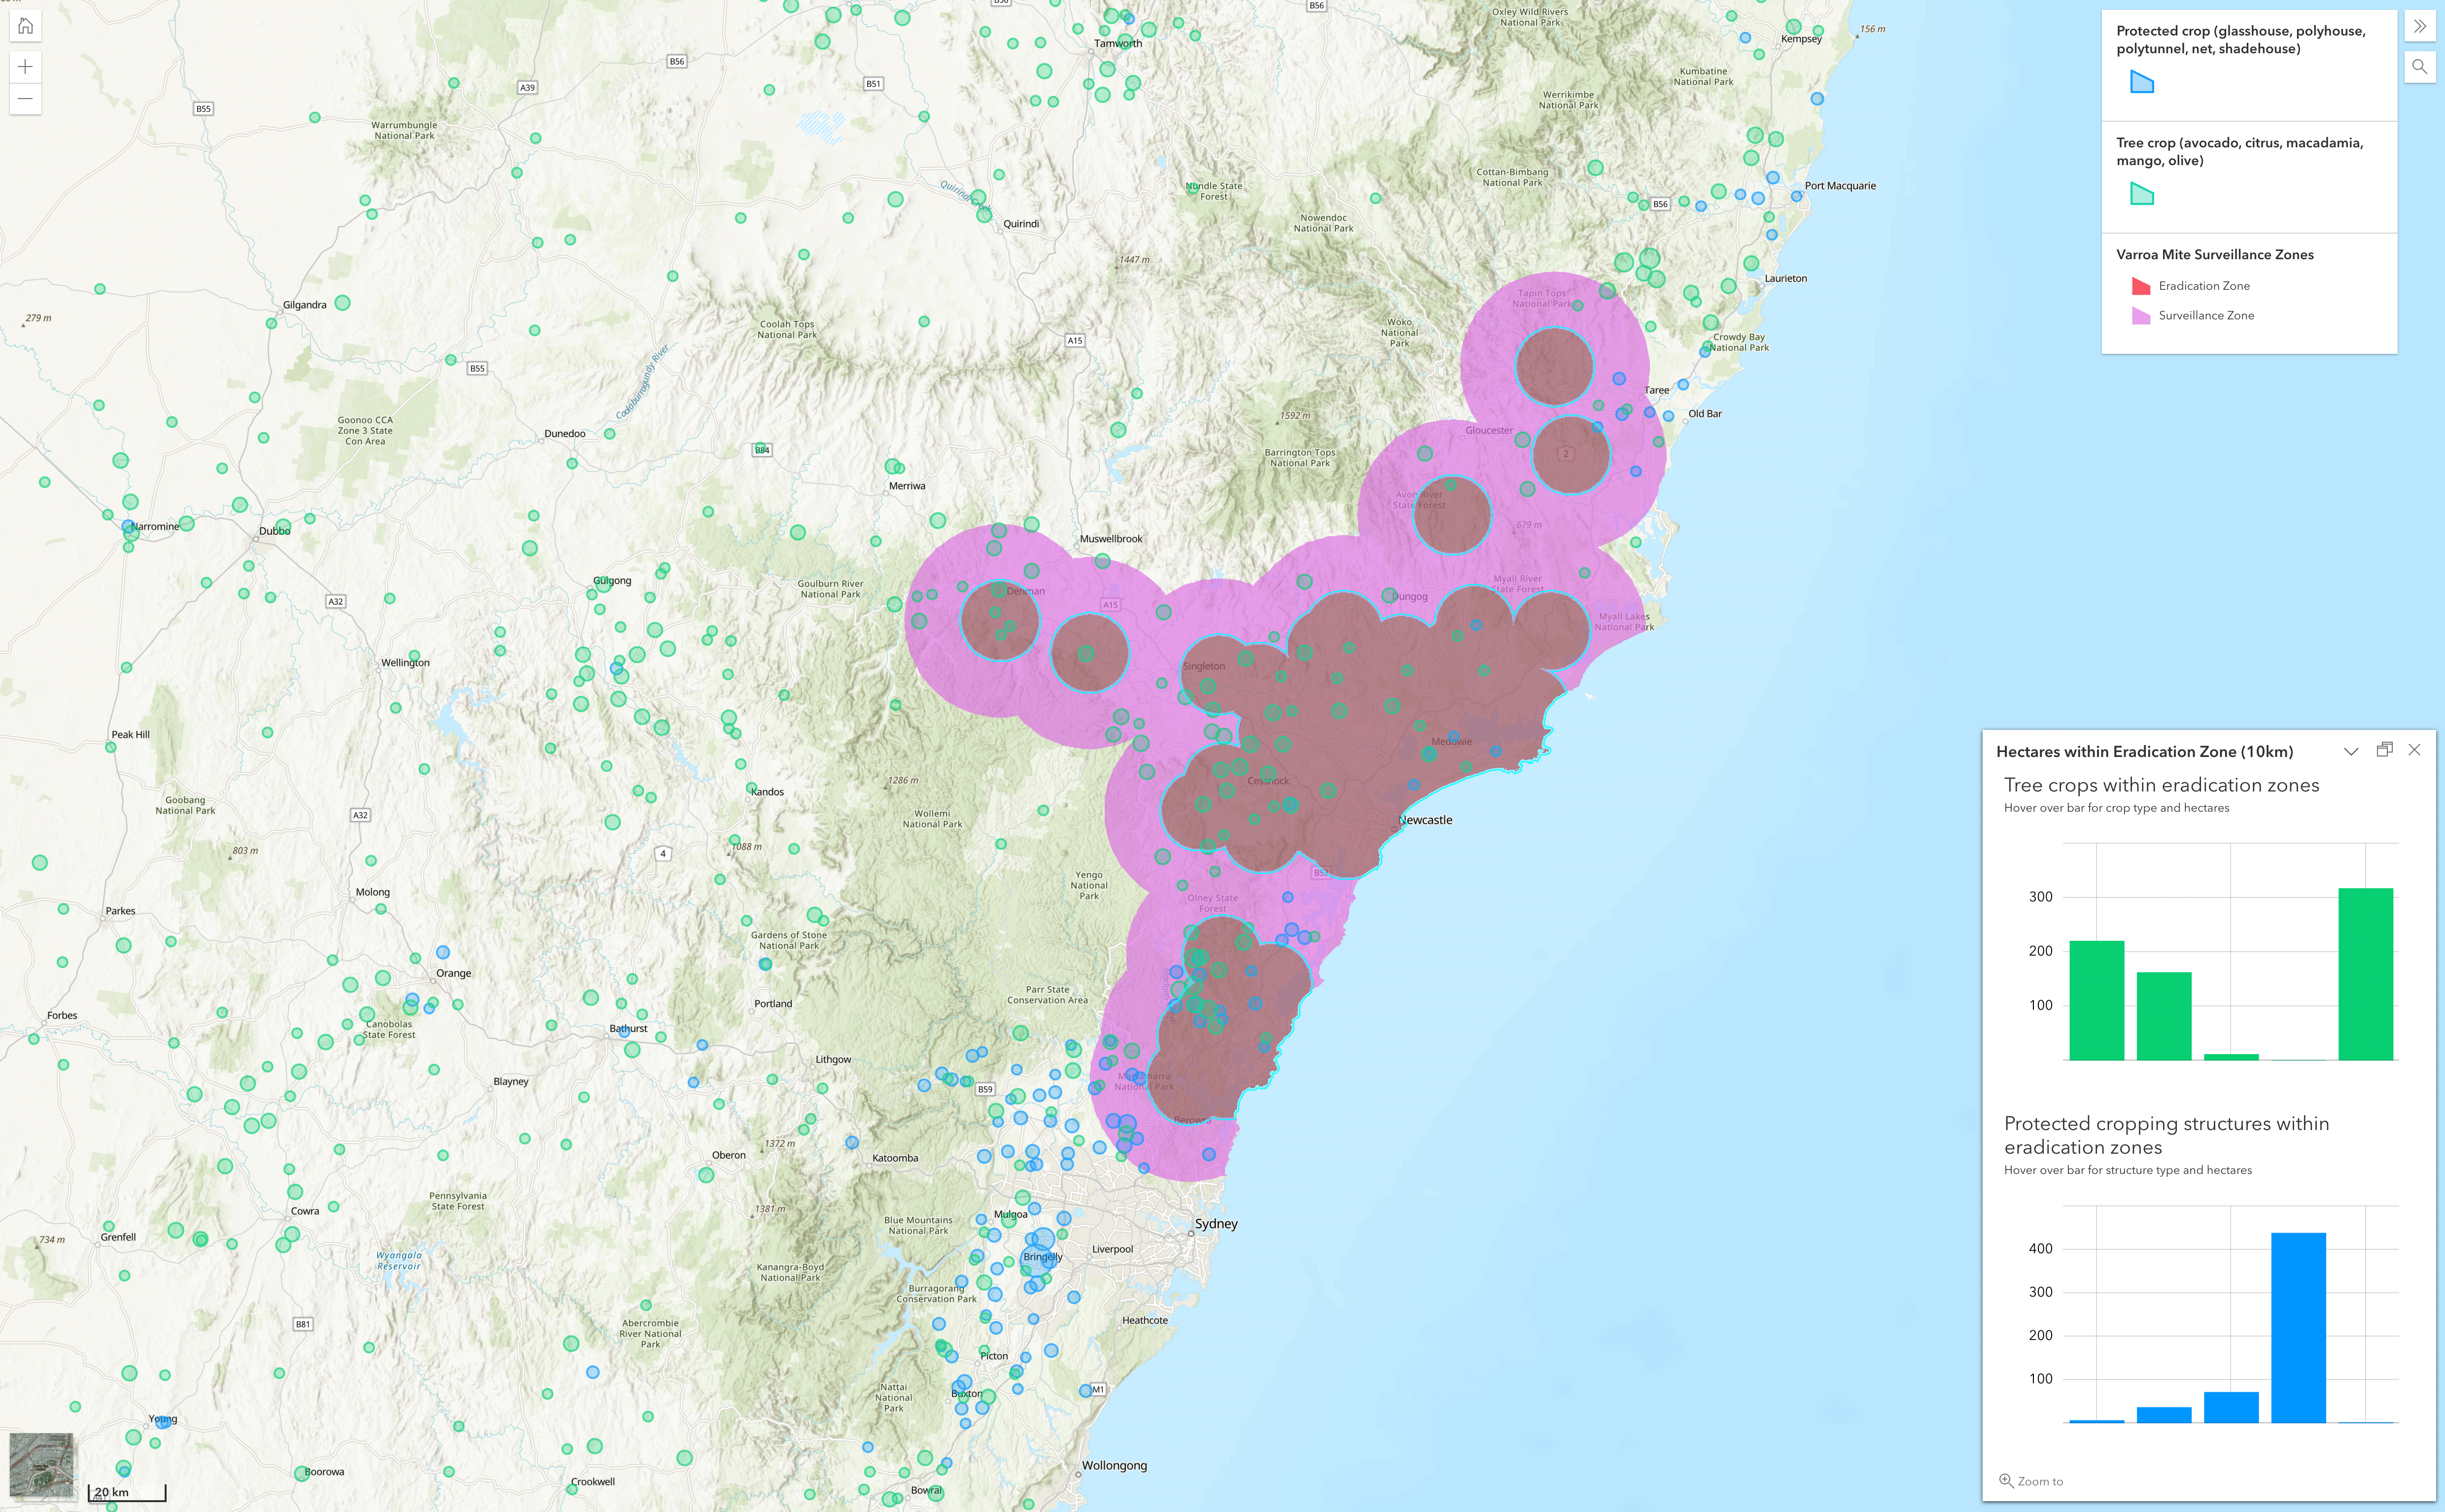
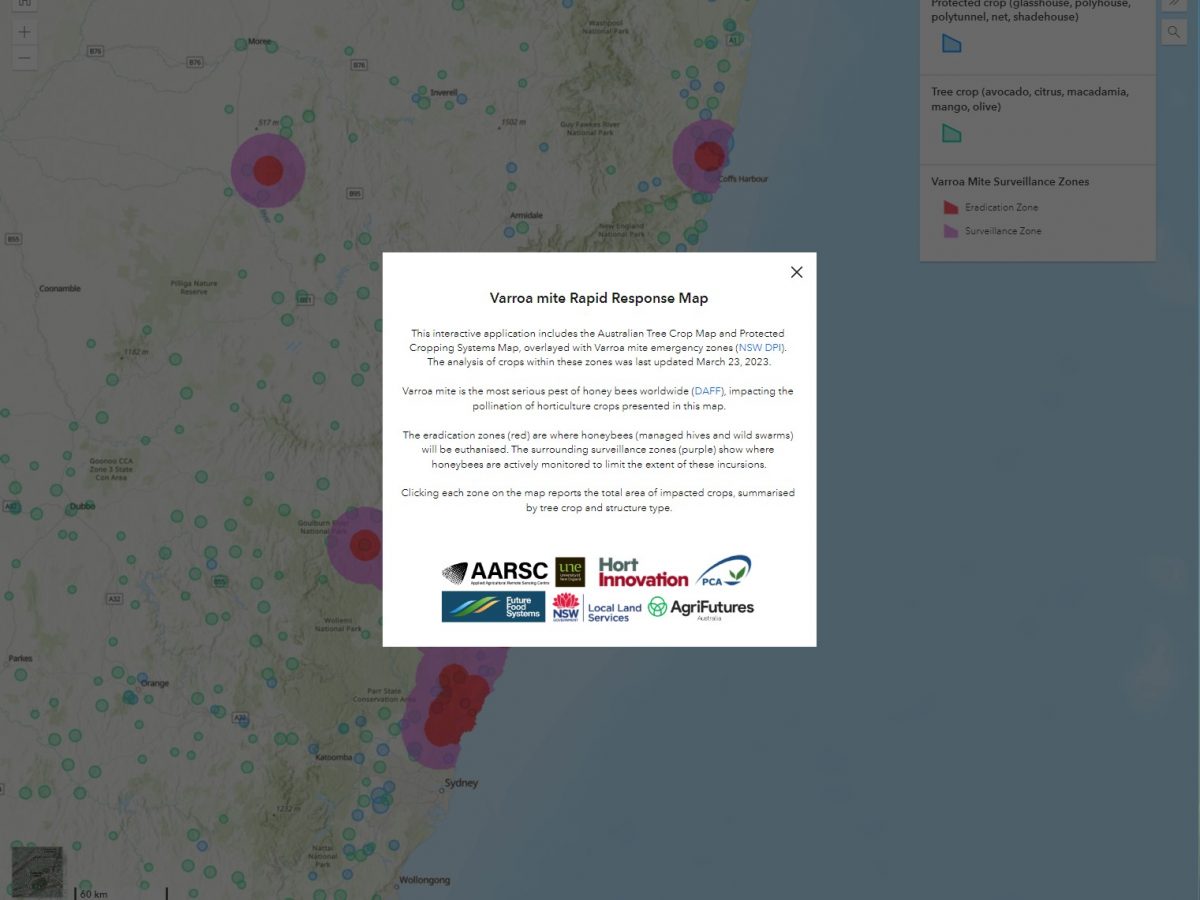
To support Australia’s biosecurity response to this potentially devastating breach, AARSC have built a Varroa Mite Rapid Response Map: a web map application leveraging the national map of PCS as well as AARSC’s Australian Tree Crop Map Dashboard.
“Our analysis for potential impact areas was derived based upon the current surveillance zones – as published by the NSW DPI and current at 23 March 2023,” explains AARSC researcher and project team member Craig Shephard. “Clicking each surveillance zone on the map returns charts in a pop-up, presenting the total area in hectares of crops and PCS within that zone, summarised by structure type.”
AARSC’s Varroa Mite Popup map. Credit: Craig Shephard, AARSC/University of New England
“The map is optimised for viewing at the desktop, and has already been viewed more than 250 times,” Shephard says. “AARSC will continue to maintain and update the application as the surveillance zones change.”
In the case of the NSW varroa mite incursion, analysis of the map has enabled AARSC to instantly pinpoint 552 ha of PCS within the ‘eradication zone’ (within 10km of varroa mite detections) and a further 1,235 ha of PCS within the ‘surveillance zone’ (within 25km).
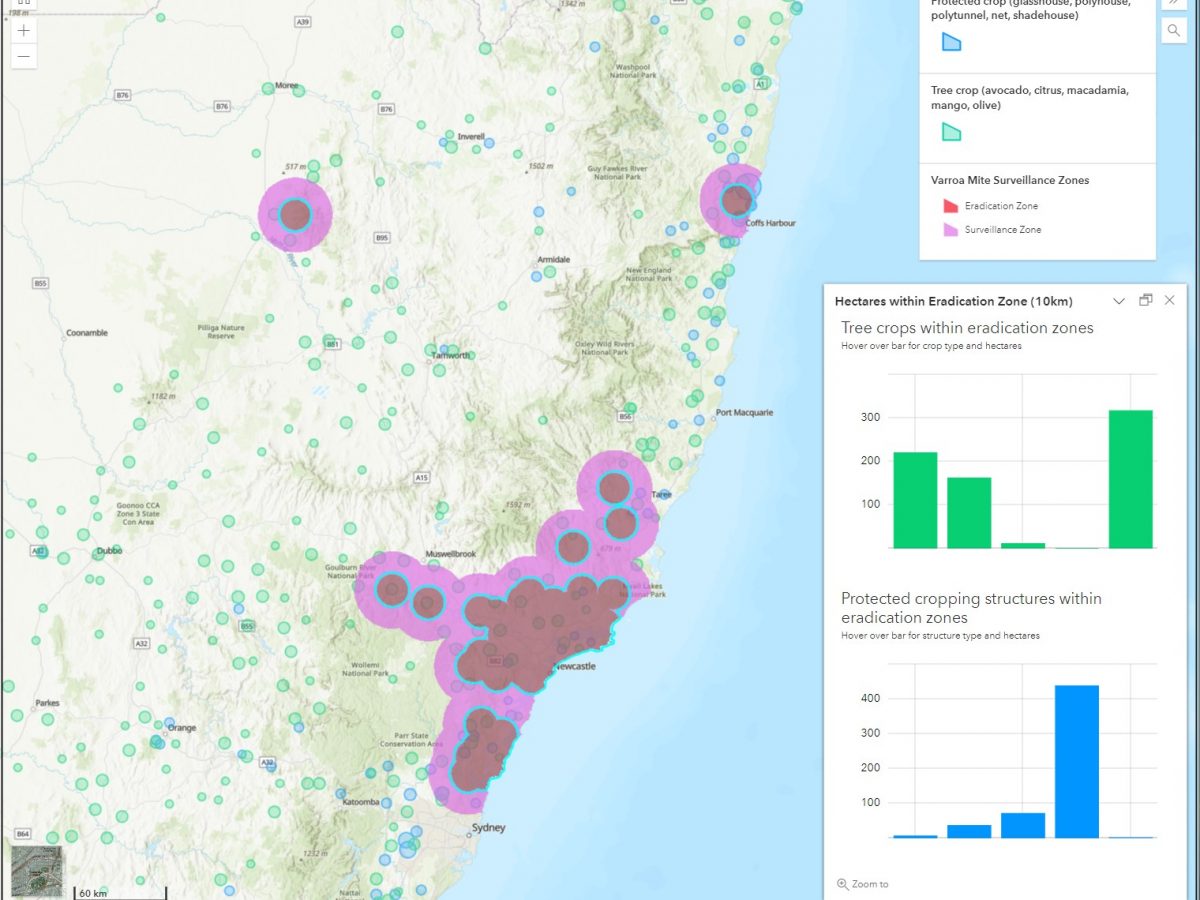
Varroa mite incursion zone mapping. Credit Craig Shephard, AARSC at University of New England
| PCS structure | Eradication zone (10km) (hectares) | Surveillance zone (25km) (hectares) | Total
(hectares) |
| Glasshouse | 6 | 0 | 6 |
| Polyhouse | 36 | 62 | 98 |
| Polytunnel | 71 | 354 | 425 |
| Net | 438 | 807 | 1,245 |
| Shadehouse | 1 | 12 | 13 |
| Total | 552 | 1,235 | 1,787 |
The Varroa Mite Rapid Response Map was able to instantly pinpoint impacted commercial PCS (numbers as at 23 March 2023).
“The Varroa Mite Rapid Response Map is a great application, leveraging the power of spatial information,” Shephard says. “Knowing where the PCS are allows for analysis and immediate action for response and recovery.
“Without the national map of PCS, you simply can’t respond effectively when these events occur. It’s essential information which is used by industry and government agencies in responding, to prioritise their limited resources where they’re needed.”
It’s just one example of how the new national map of PCS is already helping industry. “The same analysis can be applied for biosecurity events in future,” Shephard says.

PCS Survey, displayed on a mobile phone. The survey will open on any device, Shephard says. Credit: Craig Shephard, AARSC/University of New England
Continuing stakeholder updates: PCS Survey
The team has developed a simple user-friendly survey for stakeholders to contribute their feedback and new PCS for inclusion in the map. Shephard urges all stakeholders – growers, suppliers and associated industry – to use the simple survey to provide their feedback.
“The mapping team always welcomes the contribution from industry,” he says. “Anyone can assist by completing a PCS survey in a few simple steps. We’ll use this information to help inform the map. It’s absolutely essential for mapping new systems, which cannot be mapped with satellite imagery alone.”
Once the national baseline map is published, interested parties can continue to use the survey to notify the mapping team of on-ground changes in PCS.
Lead image: AARSC’s Varroa Mite Popup map. Credit: Craig Shephard, AARSC/University of New England