
Australia’s first protected cropping map was launched this week as an interactive dashboard that allows users to explore the location and area of around 14,000 hectares of glasshouses, commercial nets, polytunnels and shadehouses nationwide.
Through the map, the horticulture sector will now be better equipped to forecast yields, manage logistics, and respond to natural disasters and biosecurity threats.
Delivered through Hort Innovation and led by the University of New England‘s (UNE’s) Applied Agricultural Remote Sensing Centre (AARSC) in collaboration with Protected Cropping Australia and NSW Local Land Services, and supported by the Future Food Systems CRC, the resource provides a current measure of Australia’s horticultural production within protected cropping systems. This includes all commercial greenhouses and nets, which are used to grow crops such as tomatoes, berries and leafy greens.
Hort Innovation CEO Brett Fifield said the map is a vital tool for the sector.
“This information will allow the protected cropping sector to better understand industry demographics and will serve as an essential tool for improved biosecurity preparedness and natural disaster response and recovery,” Mr Fifield said.
The mapping project found NSW to have the highest proportion of permanent nets (3,005 ha), while South Australia boasts more than half of the country’s polyhouses (1,103 ha). In total, it identified 13,932 hectares of protected cropping structures (PCS) across Australia— a number that exceeds previous industry estimates by 30 per cent.
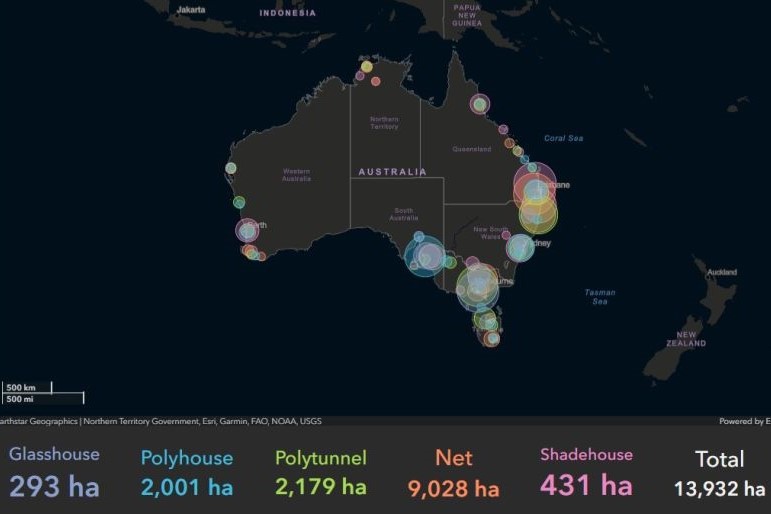
The interactive PCS Dashboard allows users to explore the location and area of around 14,000 hectares of glasshouses, commercial nets, polytunnels and shadehouses. Image courtesy of AARSC at UNE
Professor Andrew Robson, Director of AARSC, says the new resource will fill a significant knowledge gap faced by the industry.
“The map is a fundamental dataset supporting decision-making at multiple scales,” Prof. Robson says.
“At national and regional level, the map is informing strategic decision-making for industry, including new developments and market analysis for labour and transport logistics.
“At local level, the map supports growers as a collective, as knowing where crops are located is vital for an improved response to biosecurity incursions and the coordination of on-ground surveillance. It’s also necessary for quantifying area of structures affected following a natural disaster.”
Led by AARSC’s Craig Shephard, the research team primarily applied remote sensing analytics, including satellite imagery, to map the location and extent of the country’s protected cropping facilities, along with extensive industry engagement and field validation.
“Having this data on hand is invaluable in situations such as the recent Varroa mite biosecurity outbreak in NSW,” says Mr Shephard.
“We were able to leverage the PCS map to create the Varroa Mite Rapid Response Map, which is an interactive application that reports the total area of impacted structures within the eradication and surveillance zones.
“Through knowing this data, the industry has been able to accurately quantify impacts and prioritise response to affected growers, minimising impact on the supply chain.”
To ensure the data remains accurate, the map will be updated periodically, and industry will be engaged using location-based tools built by AARSC. These include the PCS Survey (best for mobile) and the Industry Engagement Web App (best for desktop).
View the PCS Dashboard here.
This project was funded by Hort Innovation through the Hort Frontiers Advanced Production Systems Fund with co-investment from Future Food Systems CRC, Protected Cropping Australia LTD, Greater Sydney and North Coast Local Land Services and AARSC.
This article was first published on the University of New England website on 17 July 2023. It has been republished here courtesy of UNE Media, with minor editorial modifications. View the original article.
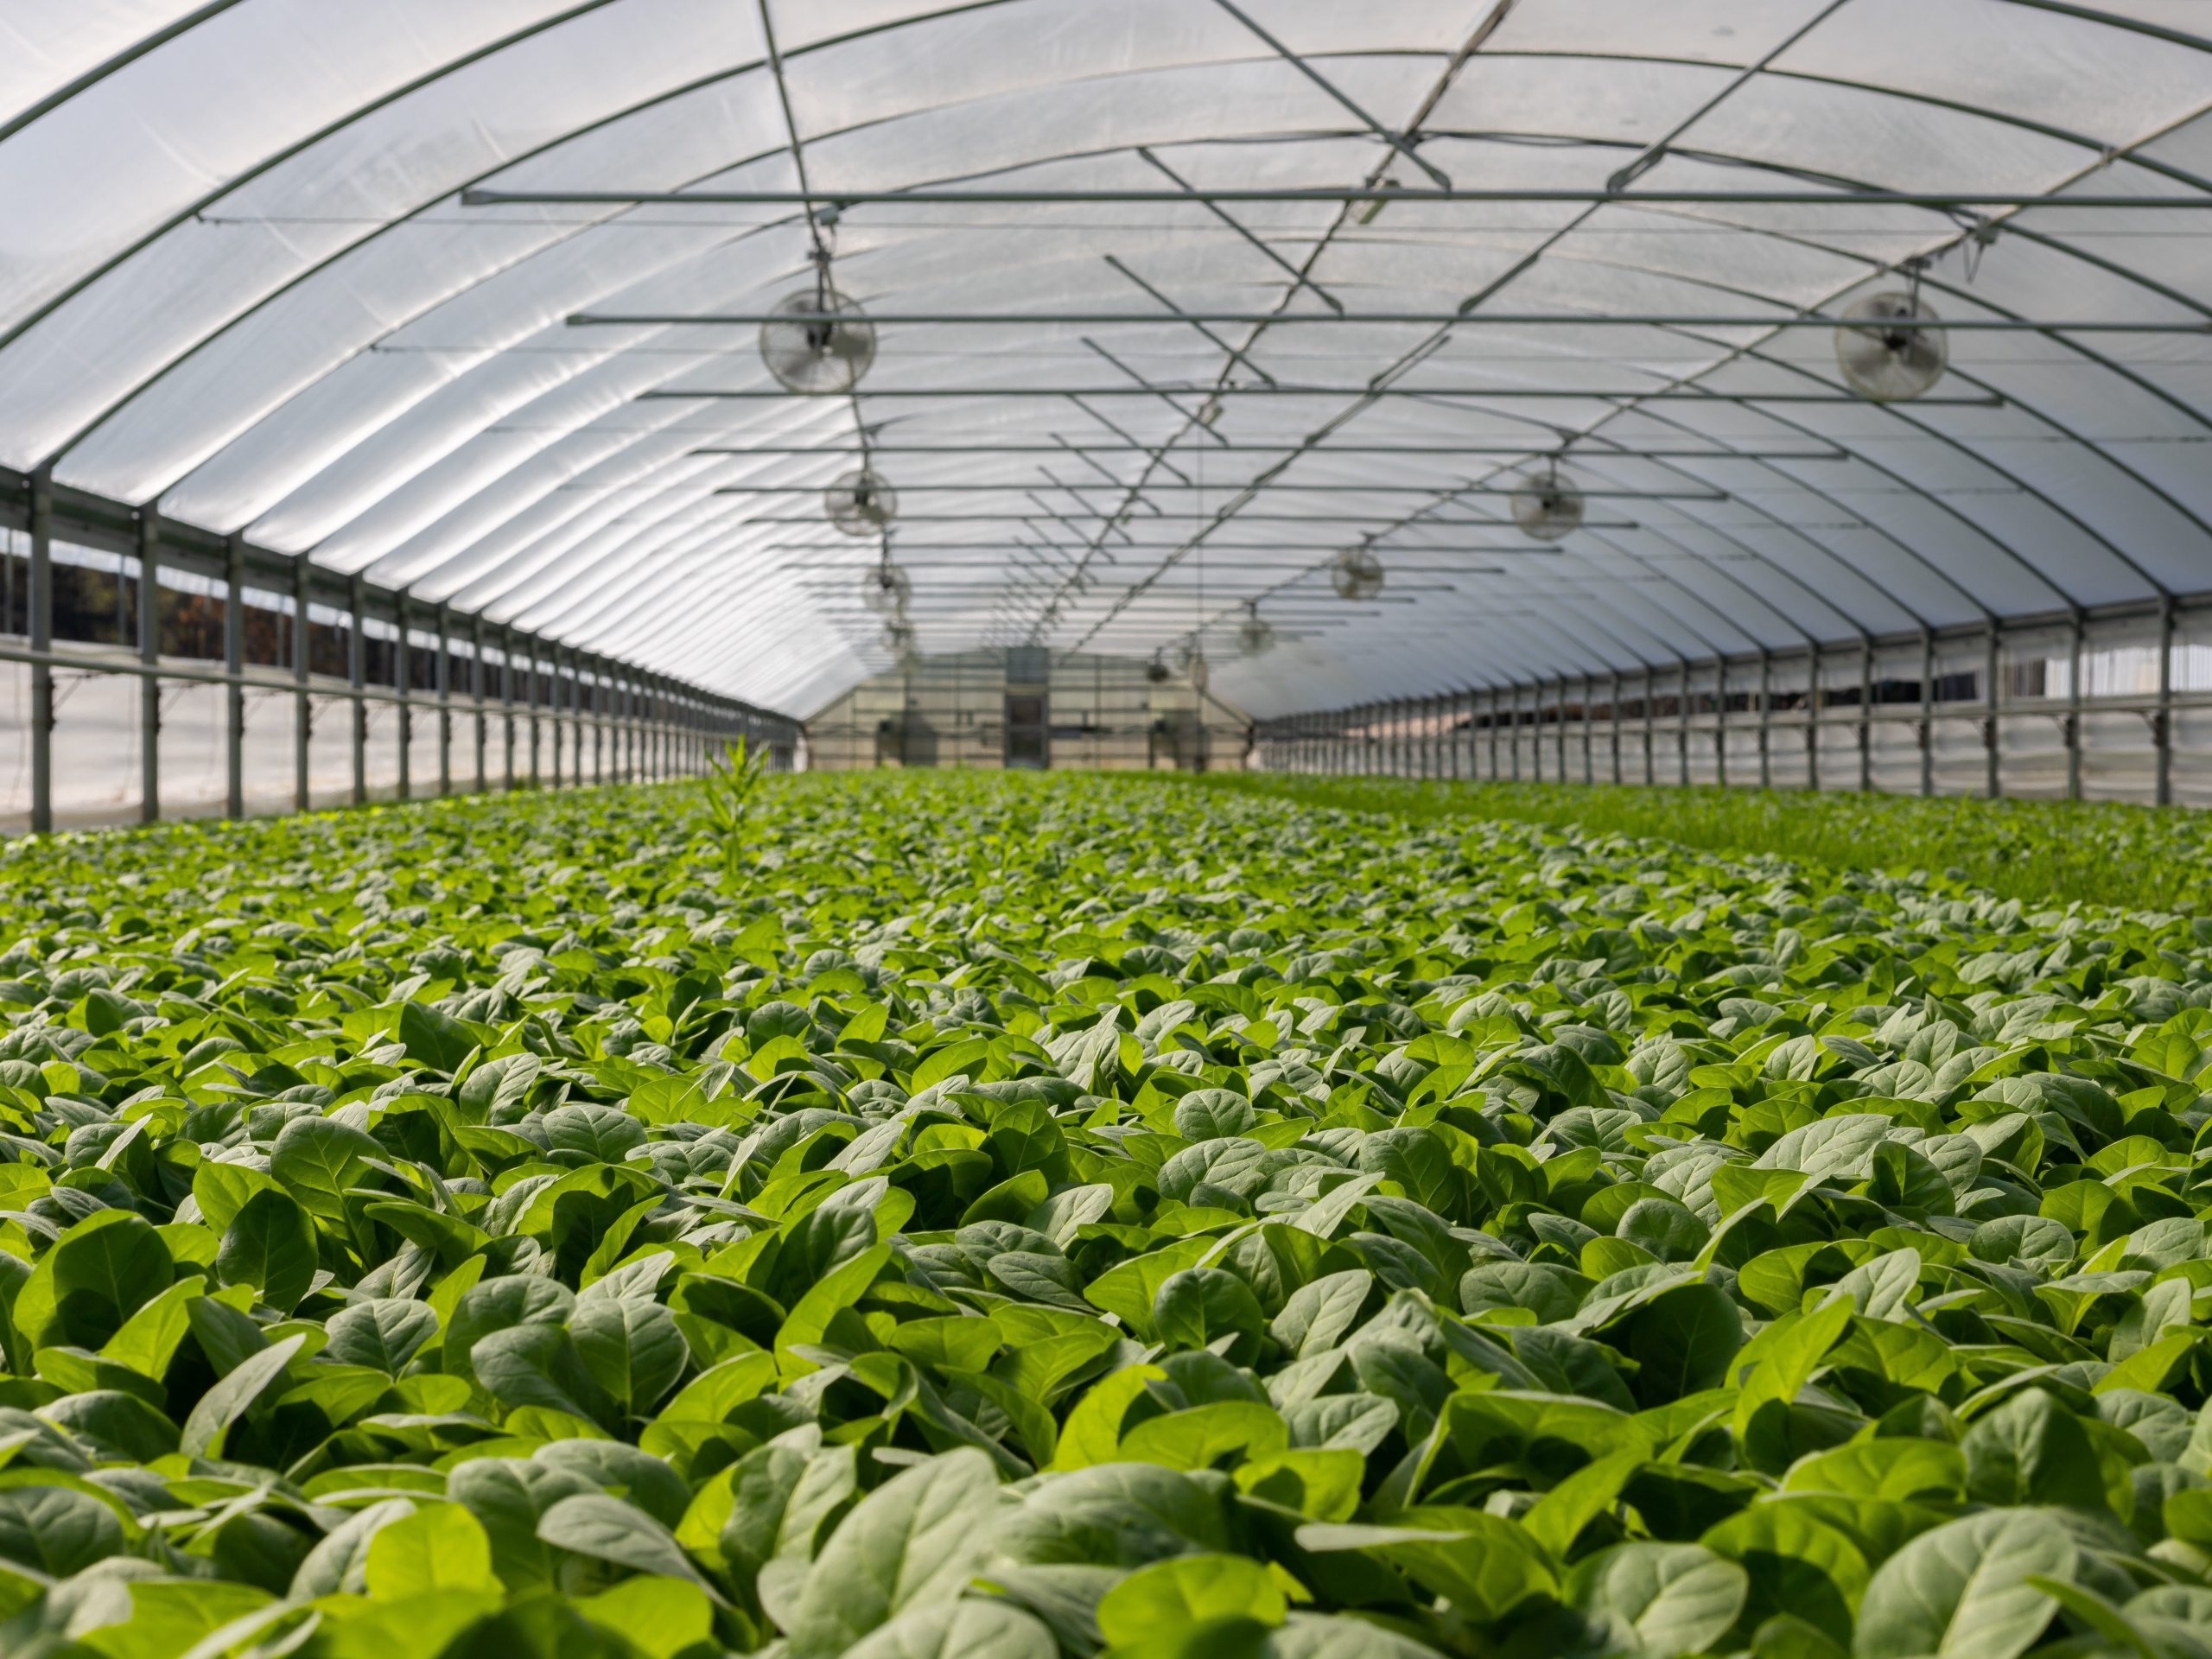
Lead image: A protected cropping facility. The horticulture sector will now be better equipped to forecast yields, manage logistics, and respond to natural disasters and biosecurity threats, thanks to the launch of Australia’s first map of protected cropping structures. Credit: Mark Stebnicki, Pexels