
The ‘National map of protected cropping systems’ project is now well underway, with draft mapping of protected cropping facilities for the Adelaide and Tasmanian growing regions now completed and mapping of WA growing regions now online and ready for peer review.
The project involves a research team from the Applied Agricultural Remote Sensing Centre (AARSC) led by Craig Shephard, with AARSC Director Professor Andrew Robson, both from the University of New England (UNE). The two–year project, due for completion on 30 June 2023, is backed by peak industry bodies Hort Innovation and Protected Cropping Australia and supported by the Future Food Systems CRC.
The project involves drawing on data collected by the project team with input from industry, including individual growers and other PC stakeholders, to develop detailed spatial maps of protected cropping facilities across Australia.
Geomapping PC facilities on a national basis will enable faster, better-coordinated industry response to extreme weather events such as flooding and bushfires, and to biosecurity threats such as outbreaks of crop pests or disease.
If and when such events occur, knowing where valuable protected cropping facilities are located will help direct resources quickly and efficiently to where they’re most needed, thereby saving valuable crops and livelihoods and potentially preventing the loss of many millions of dollars in revenue.
National map progresses
By the end of March 2022, the project team had:
- published the first draft mapping of protected cropping systems (PCS) for the Adelaide and Tasmanian growing regions and made it available for peer review via the Industry Engagement Web Application (IEWA);
- begun the process of draft mapping Western Australian growing regions, and scheduled field validations for early April;
- progressed the development of an automated image analysis approach for rapid detection of PCS, with the model being applied to high-resolution aerial imagery over South East Queensland.
The research team also presented the project and its findings to date on 30 March at the 2022 Protected Cropping Australia Conference in Coffs Harbour. The presentation brought the project to the attention of protected cropping businesses, including growers and other stakeholders, from across Australia, and highlighted the location-based tools available to enable their contribution.
The national PC mapping effort progressed further over April, with the Tasmanian and Adelaide growing regions now fully updated, says project research lead Craig Shephard.
“The field validation of Western Australia, which includes Carnarvon and the south-west of WA, was also completed over April. This mapping is now available for peer review via the Industry Engagement Web App,” Shephard notes.
“The mapping program is now drafting the map for Queensland.”
The project team has proposed building a standalone dashboard for protected cropping systems rather than including it as part of the existing Horticultural Tree Crop dashboard. AARSC will liaise with the project partners in R&D around the creation of this dashboard.
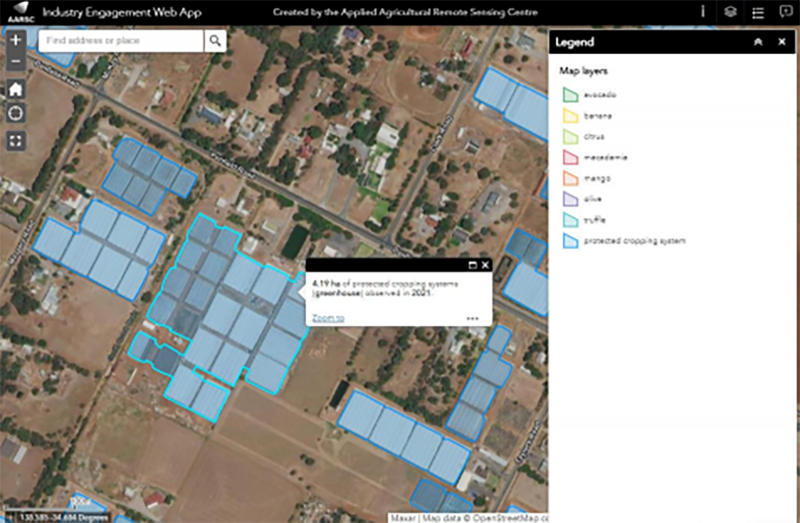
Figure 1: Industry Engagement Web Application (IEWA) showing PCS map & attributes in a pop-up. Credit: AARSC/University of New England
The IEWA: enabling stakeholder input
The published Industry Engagement Web Application (IEWA) map supports direct peer review, enabling external feedback to be submitted by growers and industry experts, then interpreted and actioned (see Figure 2).
At this stage of the project, PCS is presented as a single class at map scale, with a minimum mapping unit of 0.2ha, and additional information on ‘system type’ available as a pop-up menu (see Figure 1). ‘System’ types that can be entered include: greenhouse (including glasshouses, polyhouses and polytunnels), net (shadehouses, permanent nets) or nursery (can be a mix of types). ‘Observed year’ reflects the date on which the field observation took place or the imagery used to classify the feature was acquired – whichever is most recent. As the mapping is finalised, it will be revised and mapped consistently to the current year, using Planet imagery.
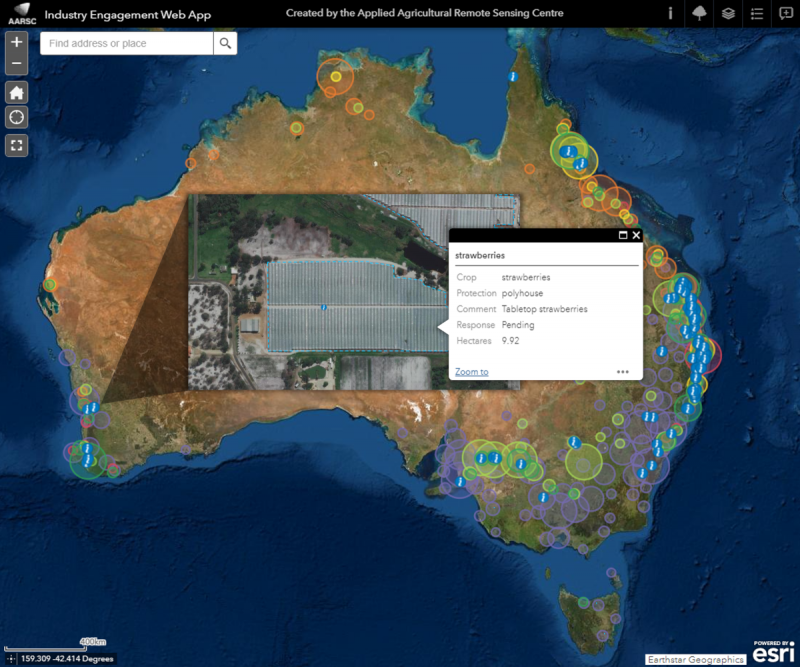
Figure 2: IEWA showing peer review comment (pop-up). Credit: AARSC/University of New England
Note that at this early stage, a PCS layer has been included in the IEWA alongside horticultural tree crops (already mapped).
The AARSC industry application gallery has now been updated to include the location-based tools supporting the project (see Figure 3).
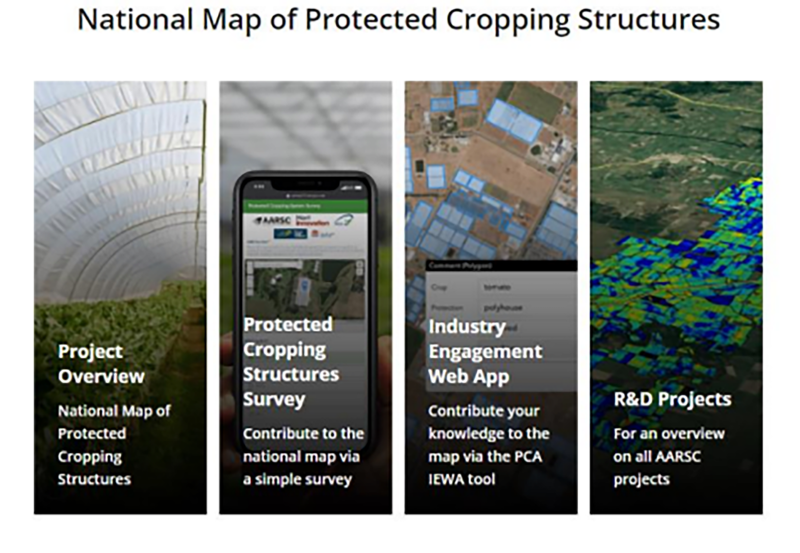
Figure 3: AARSC Industry Applications and Maps Gallery. Credit: AARSC/University of New England
The development of an automated image analysis modelling approach for the rapid detection of PCS has also progressed. “We have successfully trained a model over the Adelaide region using the draft mapping and have used this model to classify protected cropping systems in South East Queensland,” says Shephard.
“For the training of the model, an initial dataset of PCS features from the Adelaide region was manually compiled. These data provide examples of what protected cropping systems ‘look’ like in the different imagery types and, importantly, what they do not look like.
“The computer iterates through the example dataset and imagery many times and attempts to learn from the data. Once the model stops improving, it is considered fully ‘trained’ and can be applied to the same or similar imagery from a different date or region,” Shephard explains.
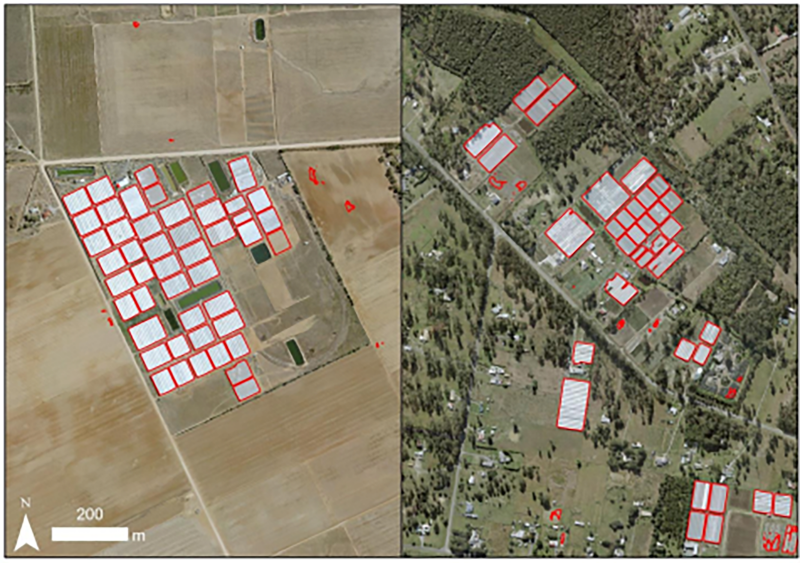
Figure 4: PCS model classification (red outline) for Port Gawler, South Australia (left) and Logan, Queensland (right). This shows an example of the output classification produced automatically by the model. Although some misclassifications still occur, the researchers intend to refine the model further over the course of the project.
The challenge of acquiring high-res imagery
“This methodology uses very high-resolution imagery; however, our ability to extrapolate this over greater areas is limited by the availability of imagery and its ‘temporal currency’ (how recently it was acquired),” Shephard explains.
To complement the analysis being undertaken on the high-resolution imagery, additional trials were undertaken over the period January-March 2022, using Planet Scope imagery (at 3m resolution) over Adelaide. Unfortunately, the results were considered less than useful thanks to their lower spatial resolution.
“Results achieved from the 3m Planet imagery were not encouraging,” Shephard notes. “They did not provide the contextual information required for the model to separate PCS from larger buildings, such as farm infrastructure and urban buildings, such as those found in industrial and commercial centres.”
The project team is now investigating using lower-resolution, broad-scale satellite imagery, which is freely available, so as to minimise reliance on potentially costly high-res imagery. “However, it is likely that additional high-resolution satellite imagery will need to be purchased for selected intensive growing regions,” Shephard says.
The progress of the mapping program (100K maptile grid) can also be viewed within the IEWA.
Stakeholders: input your PCS data and provide feedback on the map
“Our fieldwork has shown that mapping netted crops is challenging,” says Shephard. “We encourage stakeholders to help by contributing their knowledge, using the location-based tools developed for this project.”
Readers can share their feedback via the Industry Engagement Web App or simply complete the PCS Survey form. Access these tools and more from the web applications gallery: www.une.edu.au/webapps.
Further information
View the project lead’s presentation at the CRC Research Showcase in December 2021.
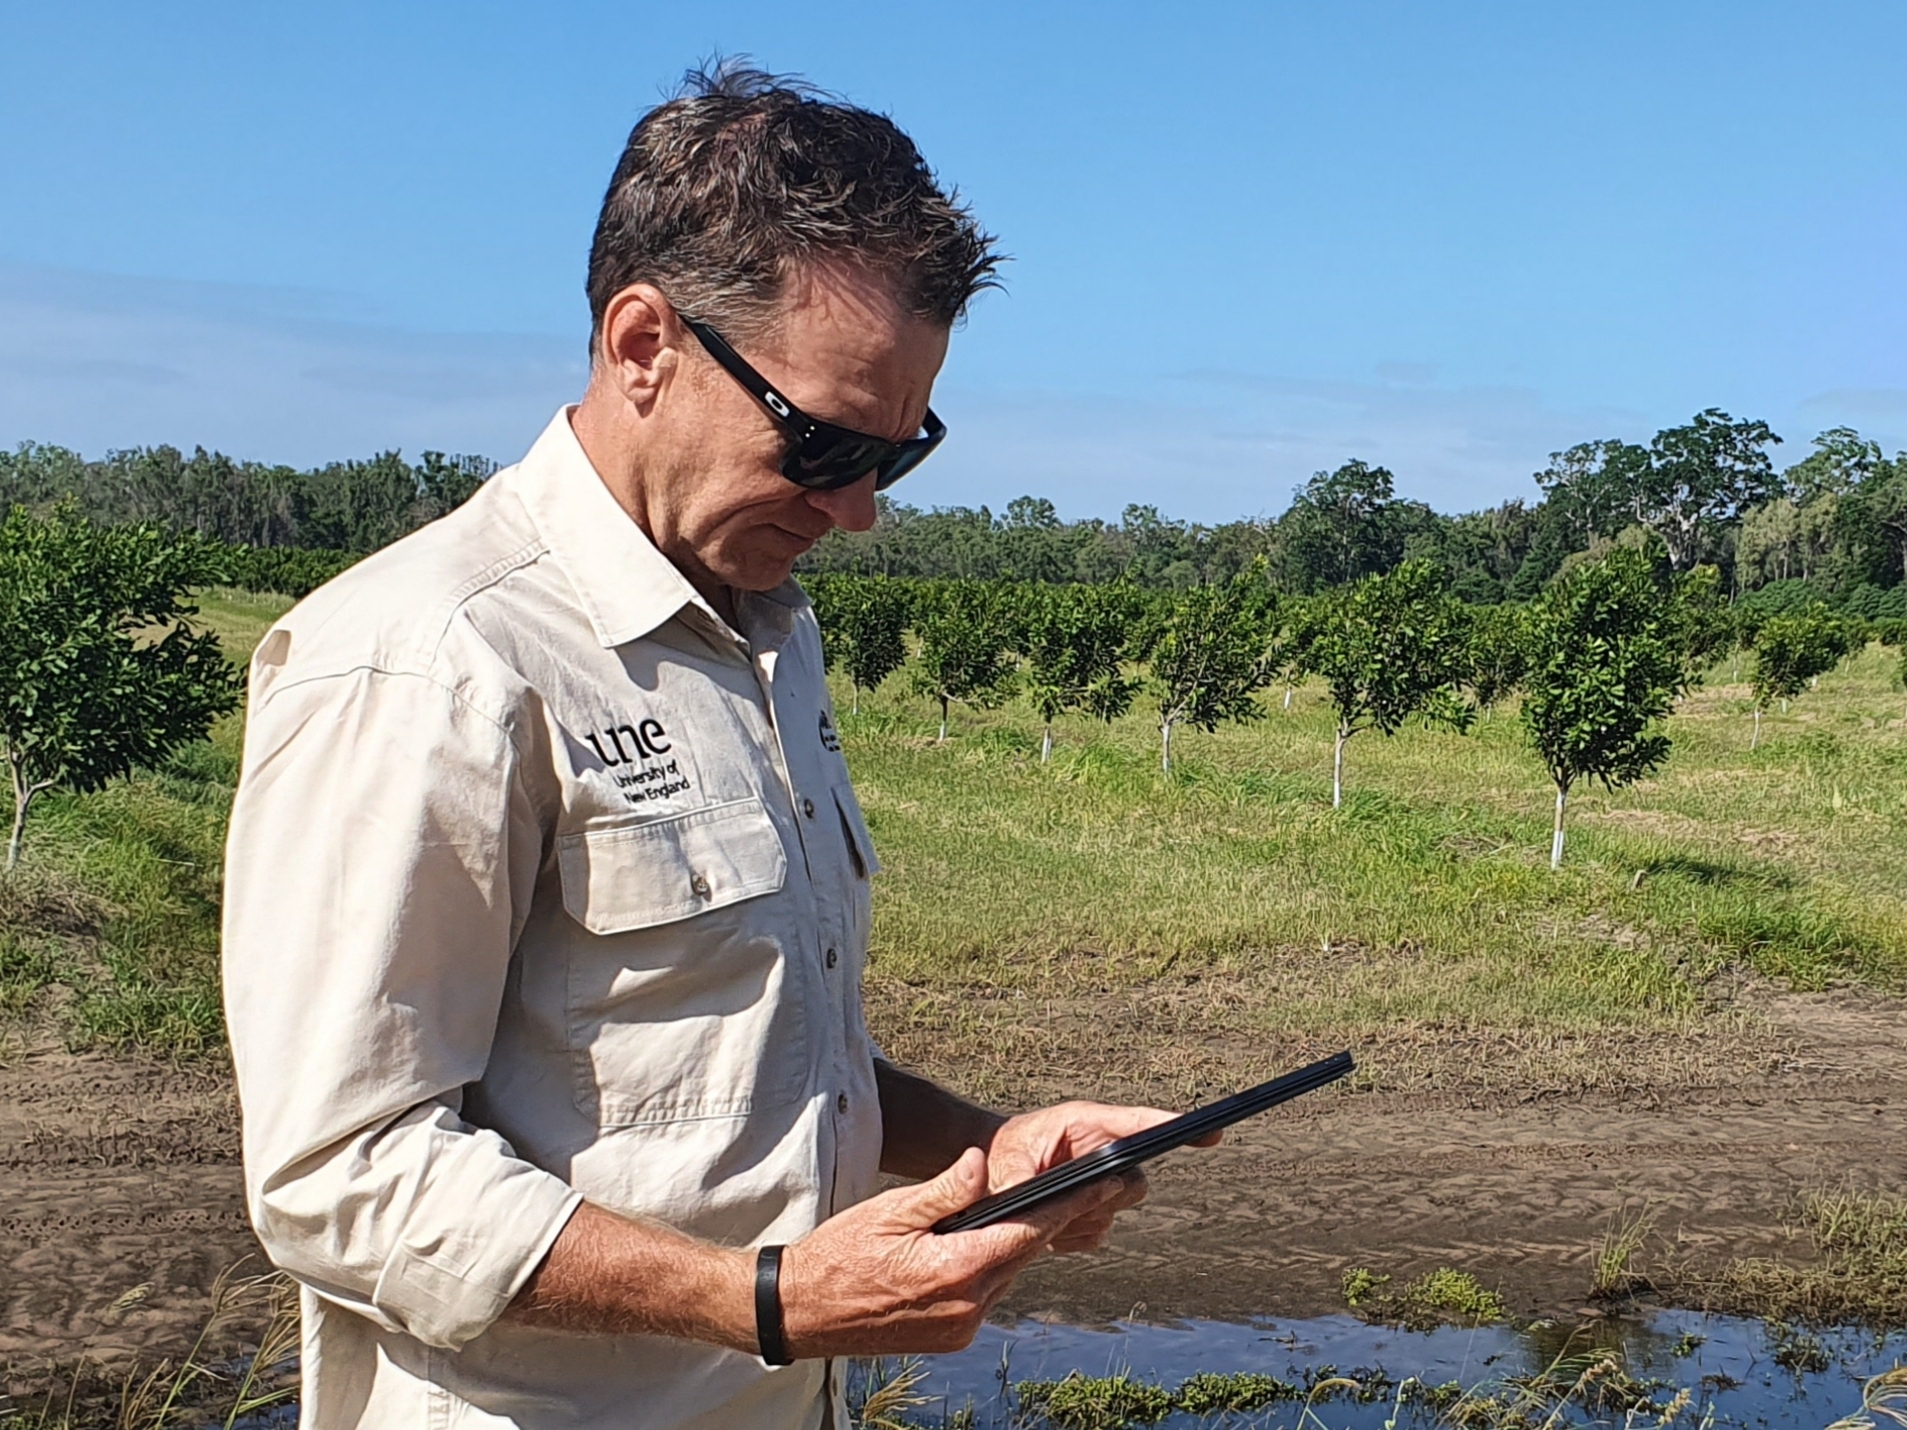
Lead image: Craig Shephard inspecting a macadamia orchard. Credit: AARSC/UNE